
June 2021 Heat Dome broke records for temperature – but not energy use, EWEB analysis finds
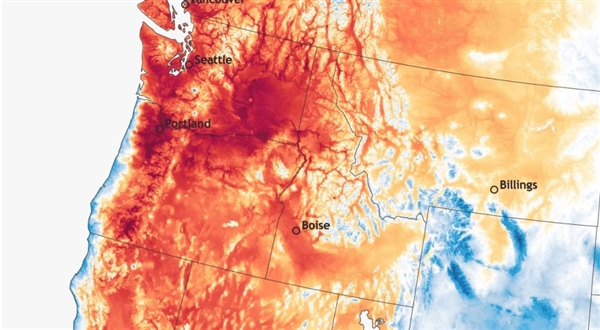
Two years ago, a mass of hot air settled over the Pacific Northwest, obliterating state temperature records. The 2021 Heat Dome lasted from June 24 to June 29 and prompted many residents to crank up their air conditioning units in an attempt to ward off the searing temperatures.
But unlike temperatures, electricity usage in the Eugene area did not break any records. In fact, the amount of energy EWEB customers used during the Heat Dome was still well below peak winter electricity usage.
That’s because EWEB is what is called a “winter-peaking” utility.
“How much energy EWEB customers use varies throughout the year, and even over the course of a single day,” said Ben Ulrich, a senior energy resource analyst at EWEB. “We’re constantly making sure that our supply of energy matches our demand by ramping up energy production or slowing it down. Usually, that means we need more energy during the cold winter and less during the warm summer.”
Community electricity usage is always changing.
The amount of electricity that EWEB customers use goes up and down from hour to hour, day to day and season to season.
Weather is the most significant driver of energy usage in EWEB’s service territory. The lowest energy usage tends to occur when the temperature is between 55 and 65 degrees, when there is minimal need for either heating or cooling. In general, EWEB uses the most electricity during the cold, dark winter months, when customers are turning on their electric heaters.
But the times of day when EWEB customers need the most energy also changes from season to season.
During the winter, EWEB tends to use the most electricity in the morning when people wake up and turn on their heaters. Usage then declines in the afternoon when the day is at its warmest and rises again in the evening when the sun sets. In contrast, during the summer, EWEB tends to use the most electricity in the late afternoon and early evening when the temperature is highest.
Overall, the peak level of energy usage on a typical winter day is about 100 MW higher than a summer day in EWEB’s territory.
In Eugene, the average energy usage at any given time is between 240 and 350 MW, with winter being at the higher end and summer at the lower end. During cold winter days, energy usage peaks routinely rise above 400 MW, and can reach 450 MW or even 500 MW. During the Heat Dome, energy usage peaked at just over 400 MW.
In the chart below, hourly electricity demand (also called load) in megawatts is on the y-axis, while hourly temperature is on the x-axis. The gray dots show every hour and the associated temperature and load between 2017 and 2020. When temperatures are low, load is higher. When temperatures are mild, load is at its lowest. And when temperatures are hot, load creaps up – but not as high as when it's cold. The three days of extreme heat during the Heat Dome are shown with green dots, which are still significantly lower than the coldest winter days.

EWEB has been conducting analysis of electricity usage as part of our Integrated Resource Planning (IRP) process. As part of the IRP, EWEB is forecasting future electricity demand and assessing the types of electricity resources that will best fit future needs. The plan will give EWEB’s elected Board of Commissioners data and insights to help them decide what energy resources to procure and what types of energy-saving programs to establish in the future.
The Heat Dome was caused by confluence of factors.
The scorching temperatures in 2021 were caused by a confluence of factors. An unusually intense high-pressure dome in the upper atmosphere settled over the region. The summer solstice had just passed, so the days were some of longest of the year. Overnight lows failed to dip below the 70s, offering little relief. And a record-dry spring prevented the soil’s usual evaporative cooling.
“This was one of the single most anomalous weather events in recorded history, not just in the Northwest, but anywhere on Earth,” said Nick Siler, Oregon’s assistant state climatologist. “It was so extreme that we can’t even really quantify how extreme it was.”
Shortly after the event, scientists worked to put a number to the role of climate change in causing the Heat Dome. After repeatedly running climate simulations, the World Weather Attribution Project determined that the Heat Dome was a 1-in-1,000-year event – that was made 150 times more likely due to global warming. Another study published last year concluded the Heat Dome was a 1-in-10,000 year event.
The Heat Dome would have been virtually impossible without climate change, but even as the planet continues to warm, these kinds of events will likely still be incredibly rare in our area.
“With that level of probability, the error bars become huge. There’s still a lot about this event that we don’t really understand,” Siler said. “But the bottom line is that climate models don’t really reproduce temperatures that extreme, even with climate change.”
EWEB's energy supply planning prioritizes future resiliency.
The unpredictability of future climate patterns, as well as yearly and daily variations in temperature, present a volatile environment filled with uncertainty that EWEB must continually manage. Some years are especially hot. Other years are cold. Some years, water is abundant and so is hydropower. Other years, drought strikes and the Pacific Northwest region’s power prices increase as utilities try to procure enough electricity for their customers.
Knowing when EWEB’s energy demand is highest will be crucial in selecting the best energy resources to procure. Not all energy resources can generate energy all the time – such as when the sun isn’t shining, the wind isn’t blowing and the hydropower isn’t flowing.
“We’re using the IRP to explore what energy sources might be the best fit for EWEB, and those needs change all the time,” Ulrich said. “A big part of that equation is determining how significant our peak energy needs are, and the resources that we can rely on to meet those peak needs.”